This post was written for the Escape Velocity blog and first appeared there.
Our last post was on the penetration of e-commerce and the proportion of retail sales contributed by e-commerce , across 5 countries. After reading it, one of our loyal readers asked us for some more information about e-commerce in India. Hence, this time we’re looking at the total value of e-commerce sales contributed by various categories of purchase / transaction.
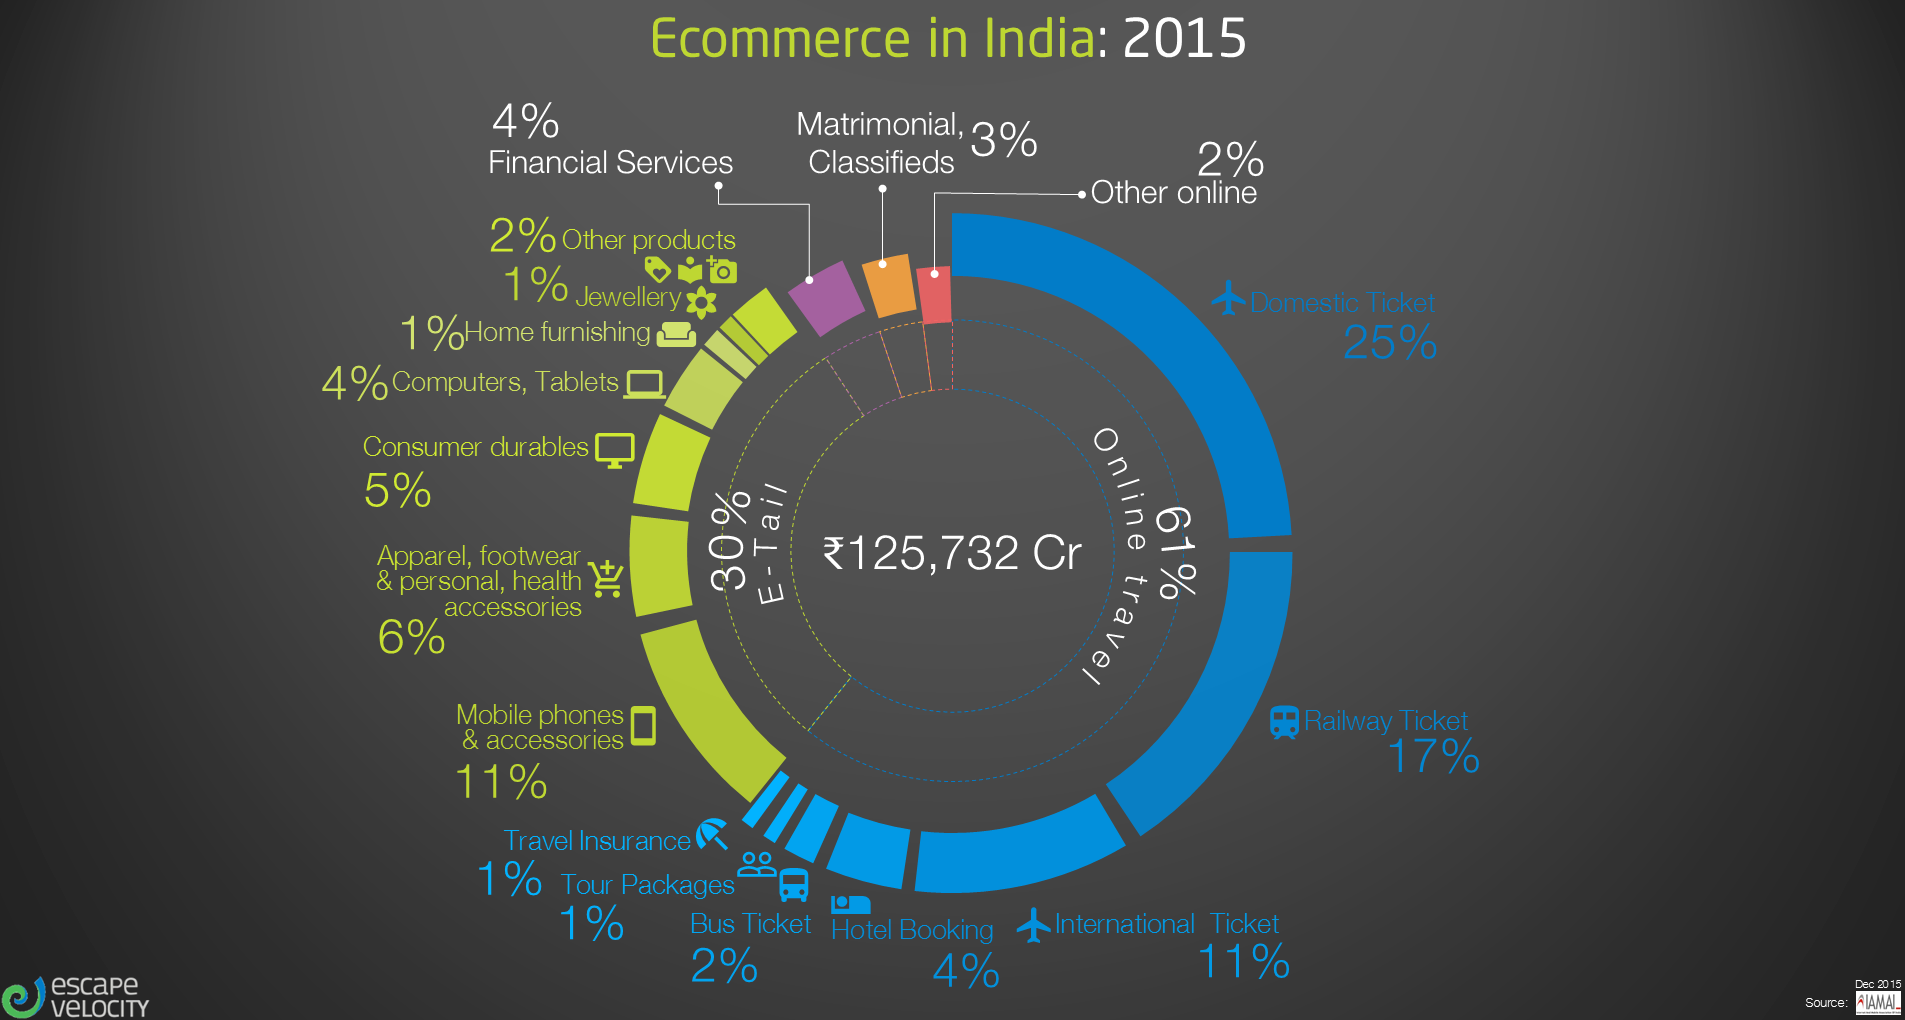
The pie-chart above shows the proportion of e-commerce sales contributed by various categories in India:
(Data source: IAMAI IMRB Icube 2015 )
- In India, the total value of e-commerce transactions was a whopping Rs. 125, 732 cr in 2015, and it grew at 28% CAGR between 2012-15.
- That online travel drives a bulk of e-commerce revenue in India is a fact that anyone who reads a newspaper is aware of ; this chart adds the details – 61% of the total e-commerce revenue of Rs. 1.25 lakh crore was driven by online travel. Of this, domestic air tickets are the largest chunk, followed by railway tickets, and then international air tickets.
- While online travel grew at a CAGR of 30% over the three years from ’12 to ‘15, rail tickets (17% CAGR) and domestic ticketing (22% CAGR) are slowing down the growth
- What we typically call e-commerce and should more accurately be termed e-tailing – i.e. the purchase of various types of products online – is actually just 30% of the total value of e-commerce transactions.
- However, e-tailing grew at a CAGR of 80% from ’12 to ‘15
- The 3 categories within ‘e-tailing’ that are driving the growth are ‘Mobiles phones’ (126% CAGR),’consumer durables’ (135% CAGR) and ‘home furnishings’ (94% CAGR).
- The ‘Food delivery’ segment , albeit relatively small at just 1.4% of total e-commerce, also grew by leaps and bounds with an 89% CAGR from ’12 to ‘15.
Now that we’re familiar with the data for India, let’s compare the proportional split of e-commerce sales in India by category with that in the U.S. :
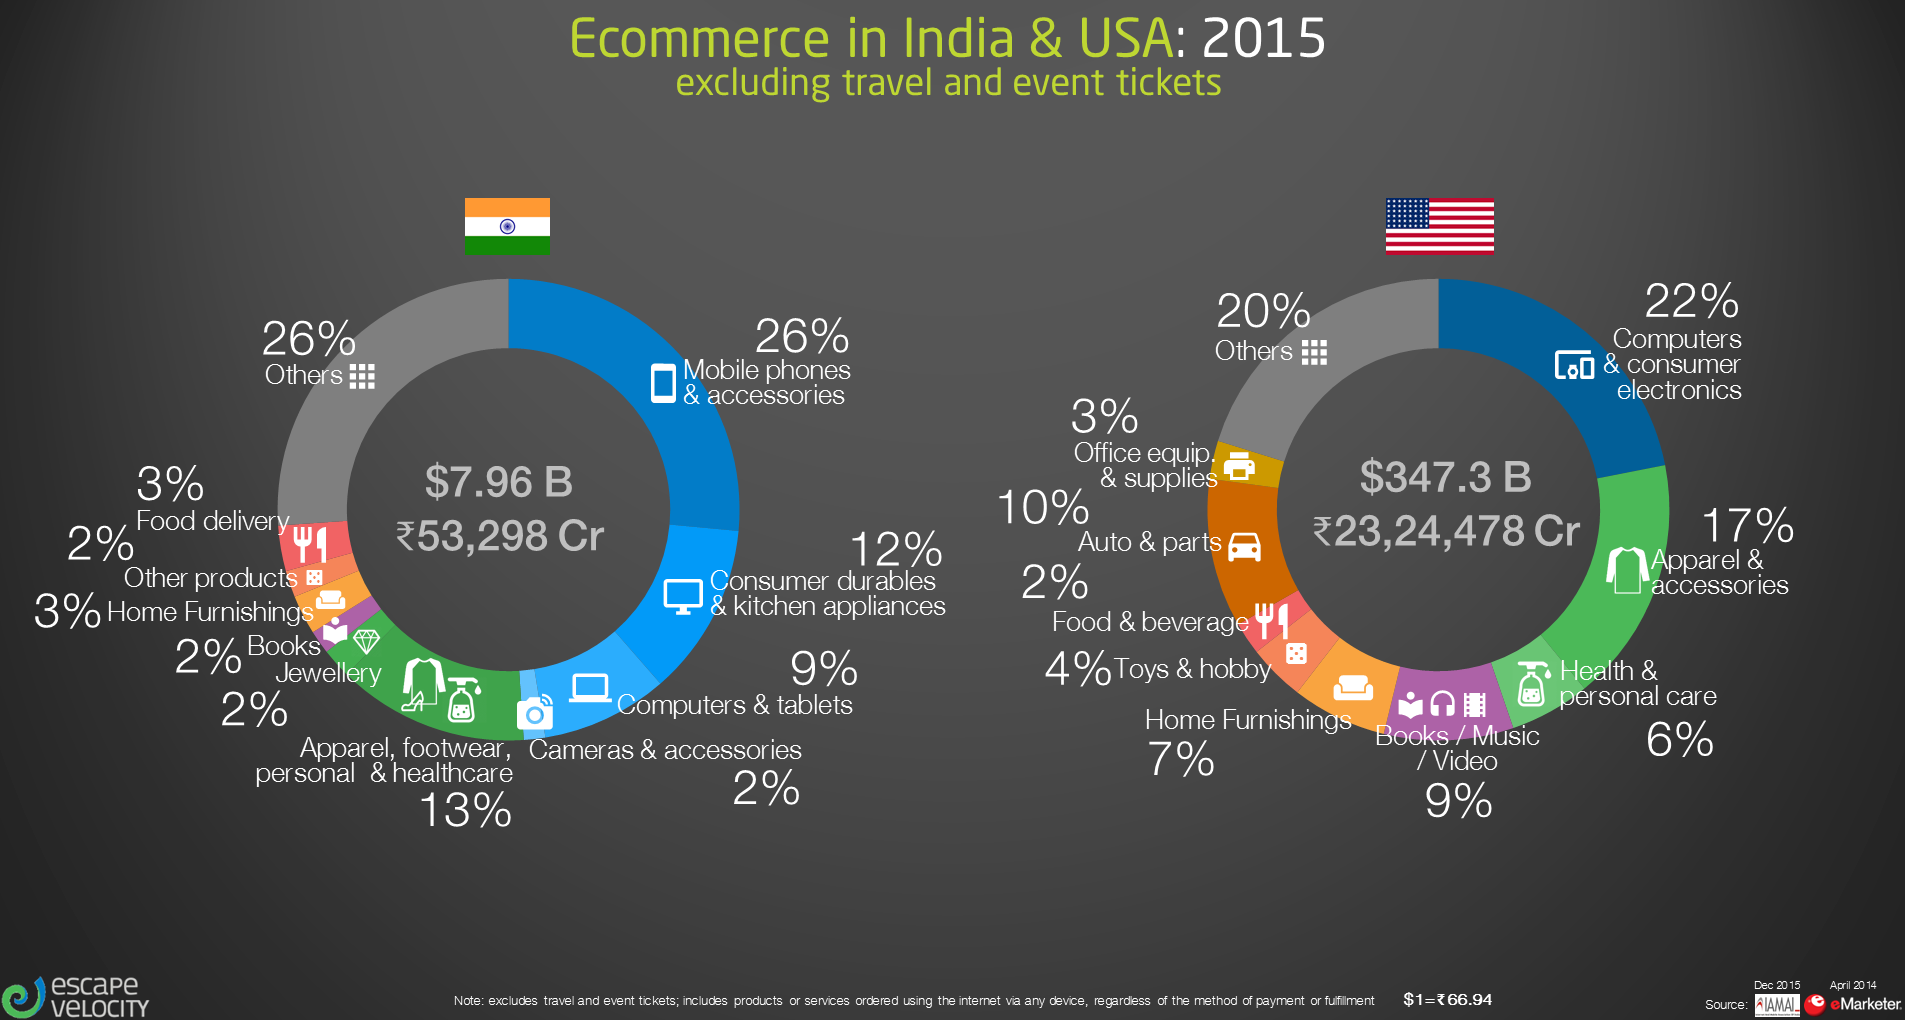
(Data source: IAMAI IMRB Icube 2015 ; eMarketer Apr 14 for US showing 2015 projection, validated through other sources )
- In e-tailing in India, there is an over-dependence on ‘computers, durables and consumer electronics’ as compared to the U.S. – almost 50% of total e-tailing in India vs. 22% in U.S.
- If we benchmark to U.S., most categories in India – e.g. ‘apparel’, ‘personal care’, ‘home furnishings’, ‘books’, ‘auto and parts’ – have the scope to grow faster than ‘computers, durables and electronics’. Of course, benchmarking to the U.S. is something that could led to wrong conclusions too, as so many e-commerce firms in the hyperlocal space have seen recently ; hence the need to tread carefully after investigating consumer needs, current satisfaction levels and the nature of the gap
- Interestingly, ‘Auto and components’ is something that hasn’t taken off in e-commerce in India at all, while in the U.S. it is 10% of e-commerce by value. The Indian online car market is limited to ‘second hand cars’ which is mostly a ‘classifieds’ business.