SCIAM has a wonderful 175th anniversary edition.
One article which is a must look for data science and data discovery aficionados is this one with visualisations of the most popular words used in every edition of the magazine since their launch. That’s 5107 editions, over 100.2mn words analysed…
The article – The language of Science. It’s interactive version where you can see how about 4000 terms peaked along with similar trending terms and inverse trending terms. And finally the behind the scenes tech use with this twitter thread providing more details of the tech behind it. The behind the scenes article also lists the challenges – OCR errors, how to analyse and of course how to visualise.
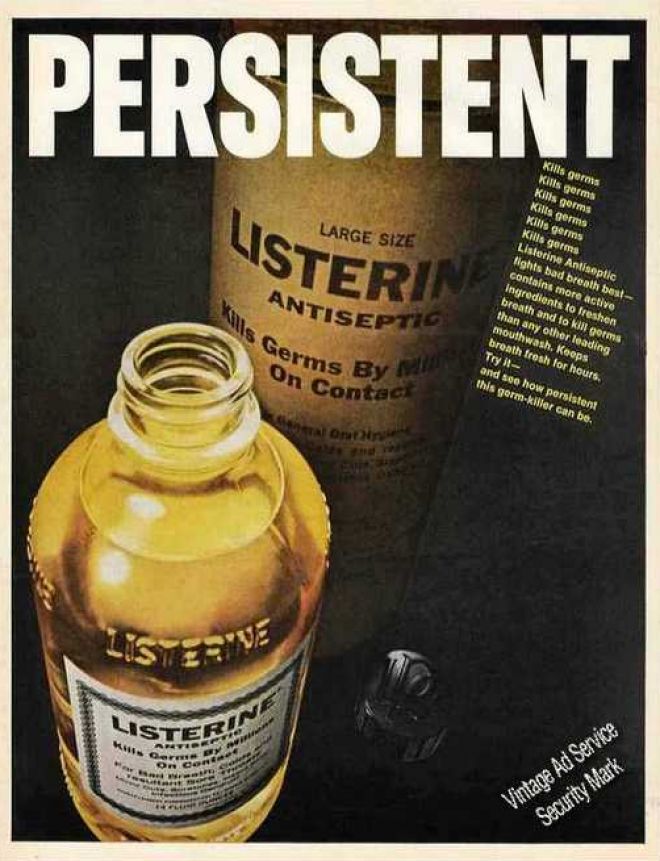
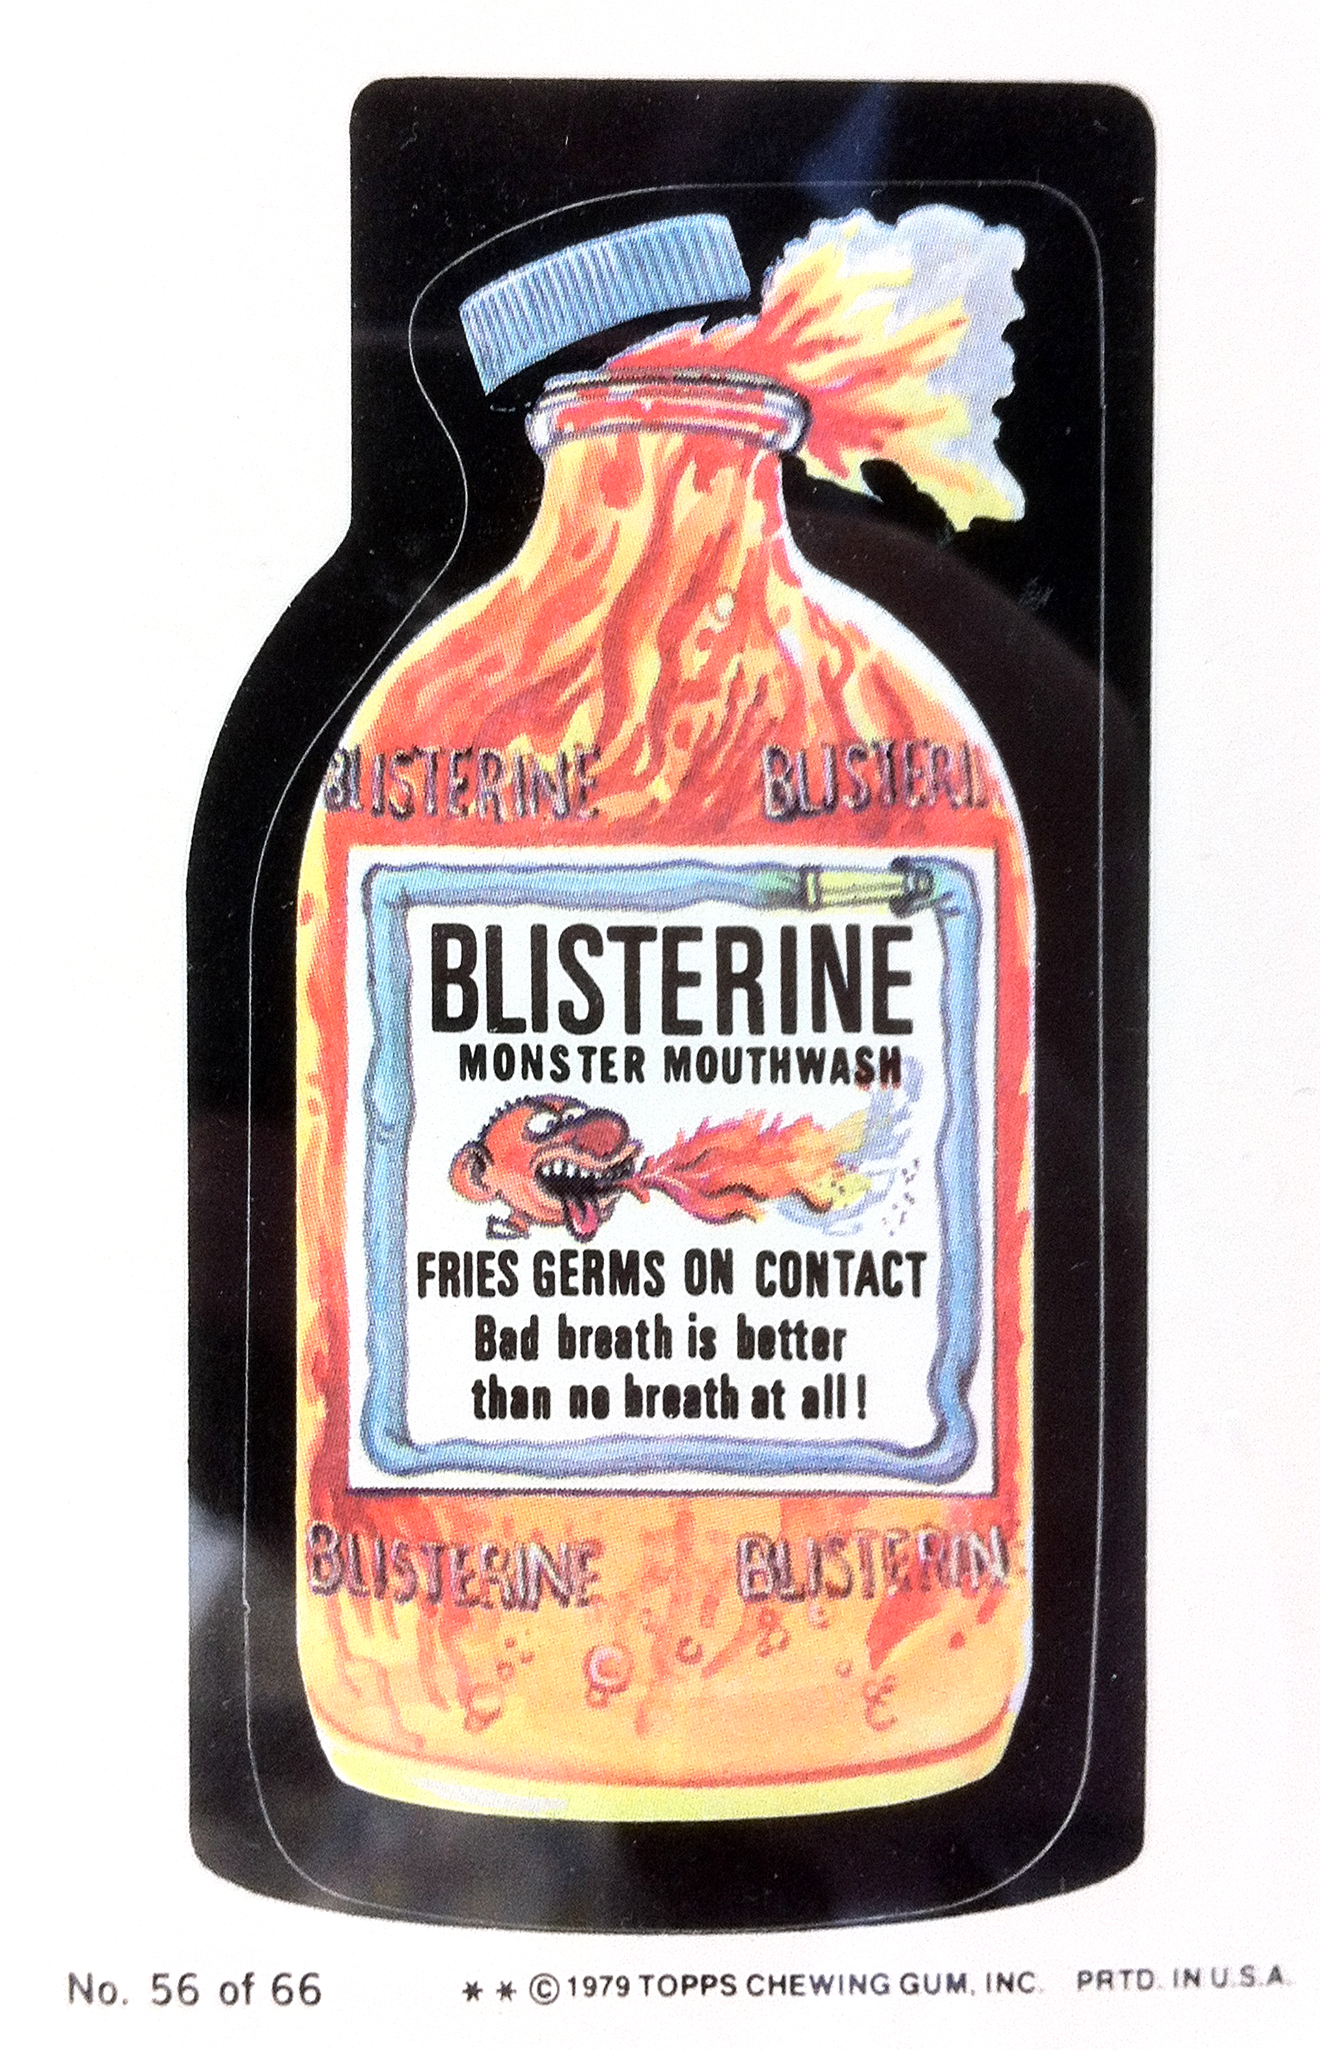
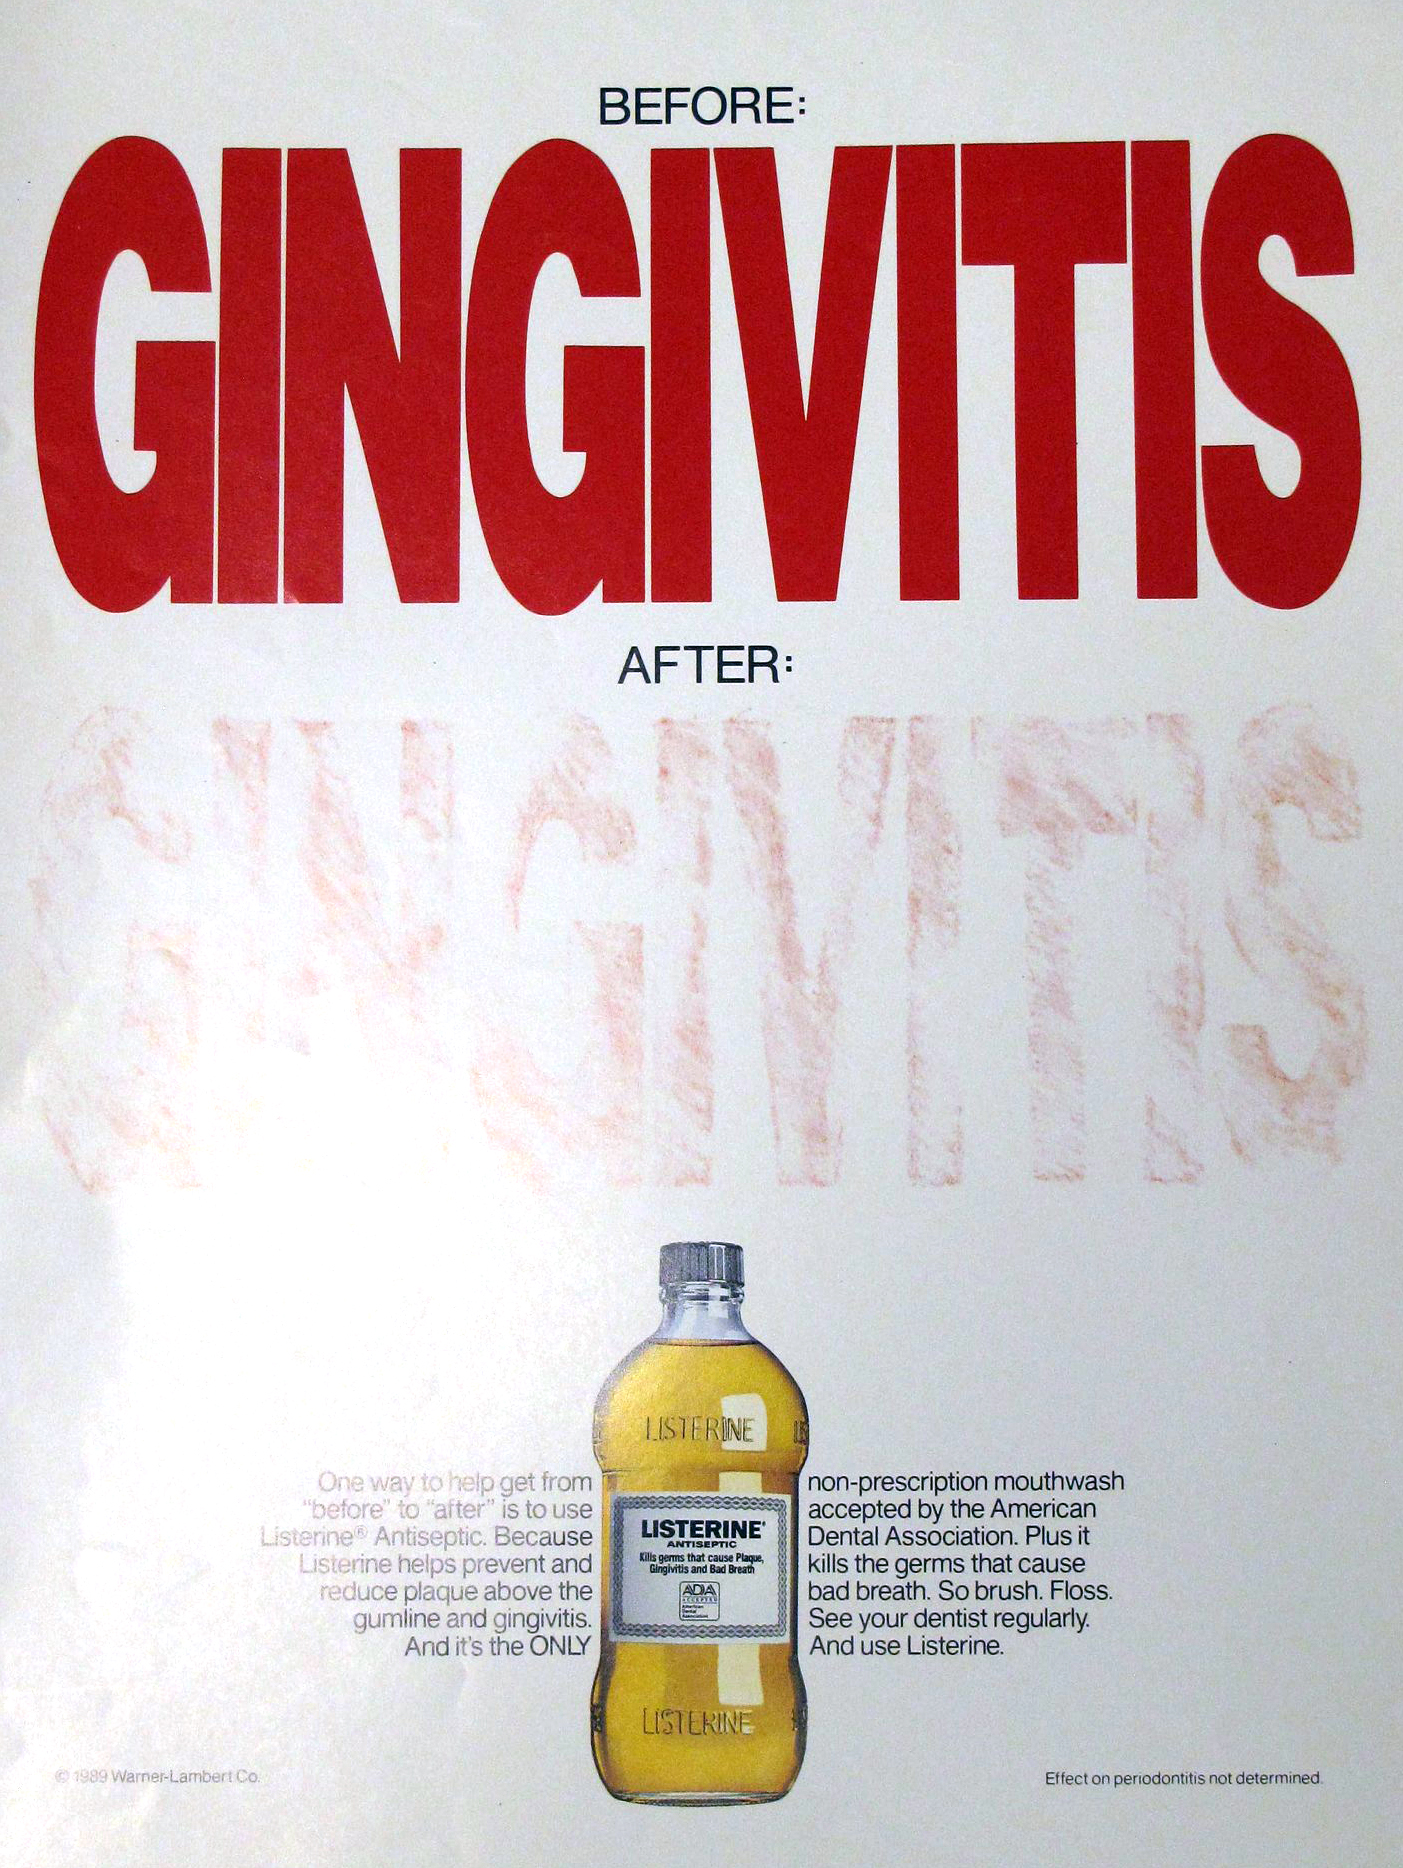
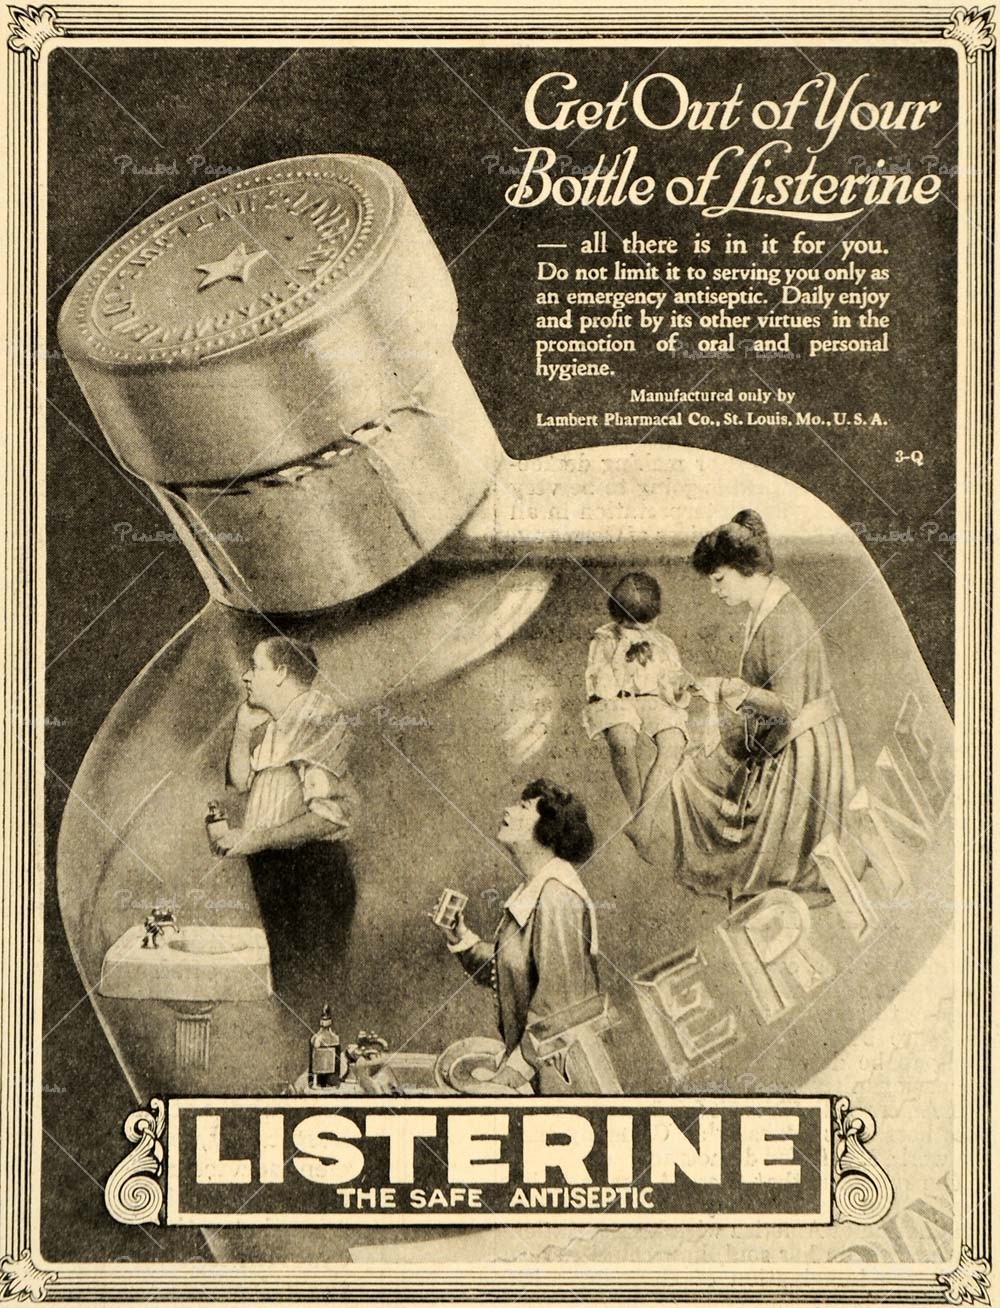
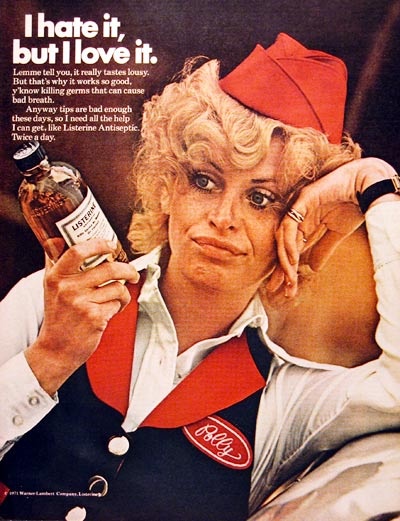
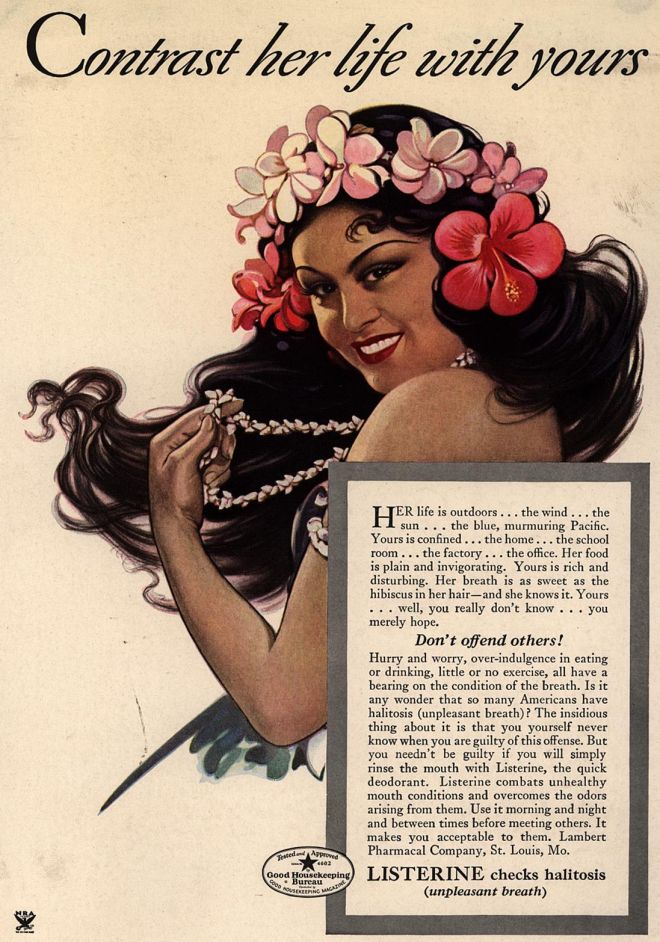
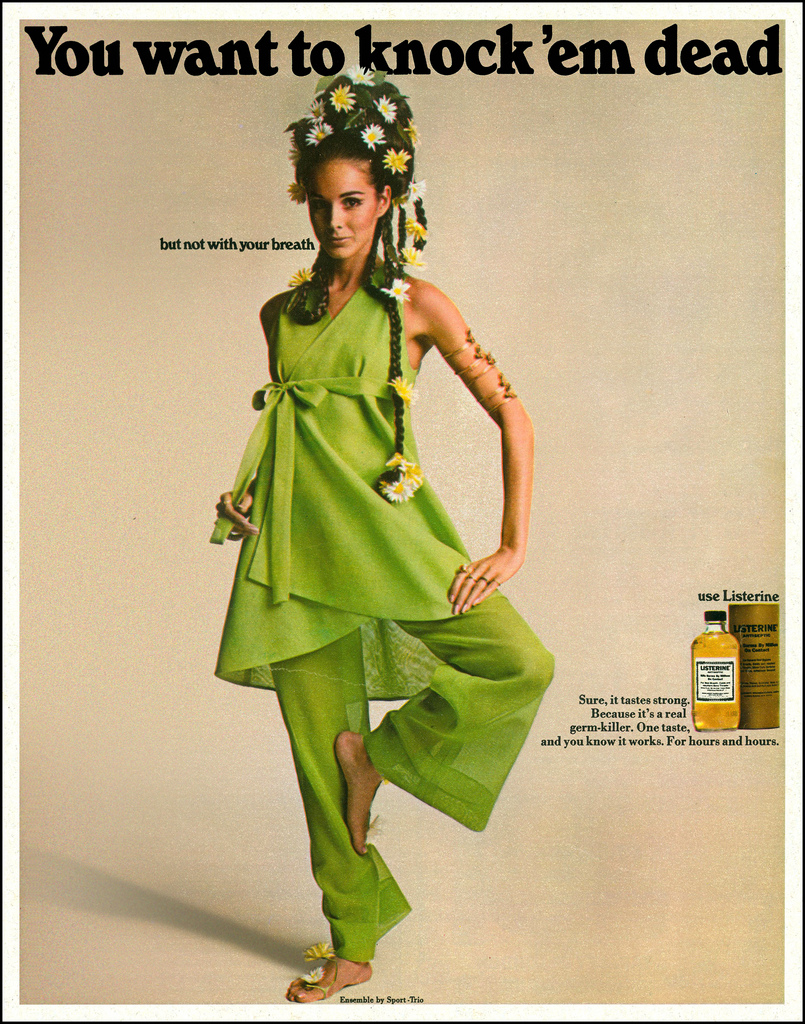
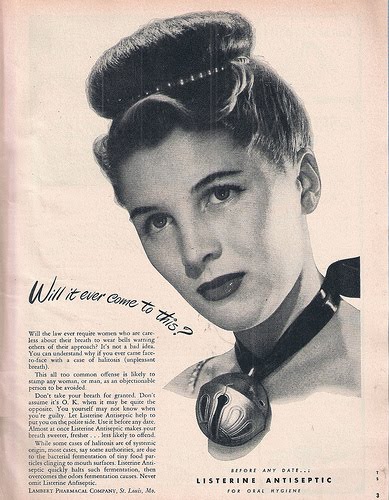
Now, way back in 2010-11, I had got hold of 120+ historical print ads of Listerine in pdf/image formats and One of my thoughts was to analyse them to see how the communication strategy and messaging has changed over time. The visualisation tool of choice was babel (almost a dead link now) then. Analysing the text was out of question as these print ads were text heavy so wanted to run them through an OCR, but the challenge of reading them properly remained due to the quality of scanning and the project didn’t take off.