This post was written for the Escape Velocity blog and first appeared there.
In Q4 ’15, India surpassed the US to become the #2 market in terms of Internet users behind China. However, e-commerce sales in India are nowhere near the value they generate in the U.S. or in China. So here’s a look at internet penetration, digital buyers and e-commerce sales of the top 5 countries by total retail Sales.
We’ve been interested in this topic for a few years now ; in a post almost two years ago we tried to gauge the penetration of e-commerce in four BRIC countries by comparing the proportion of their population that was active online vs. the proportion of population that actually shopped online. In today’s post, we’ve gone one step further and looked at the value of sales originating from those that shop online, i.e. the proportion of total retail sales value that is contributed through the e-commerce channel. For this purpose, the countries that we’ve chosen are those that are the top 5 in terms of total value of retail sales, namely USA, China, Japan, Germany and India, in decreasing order of sales value.
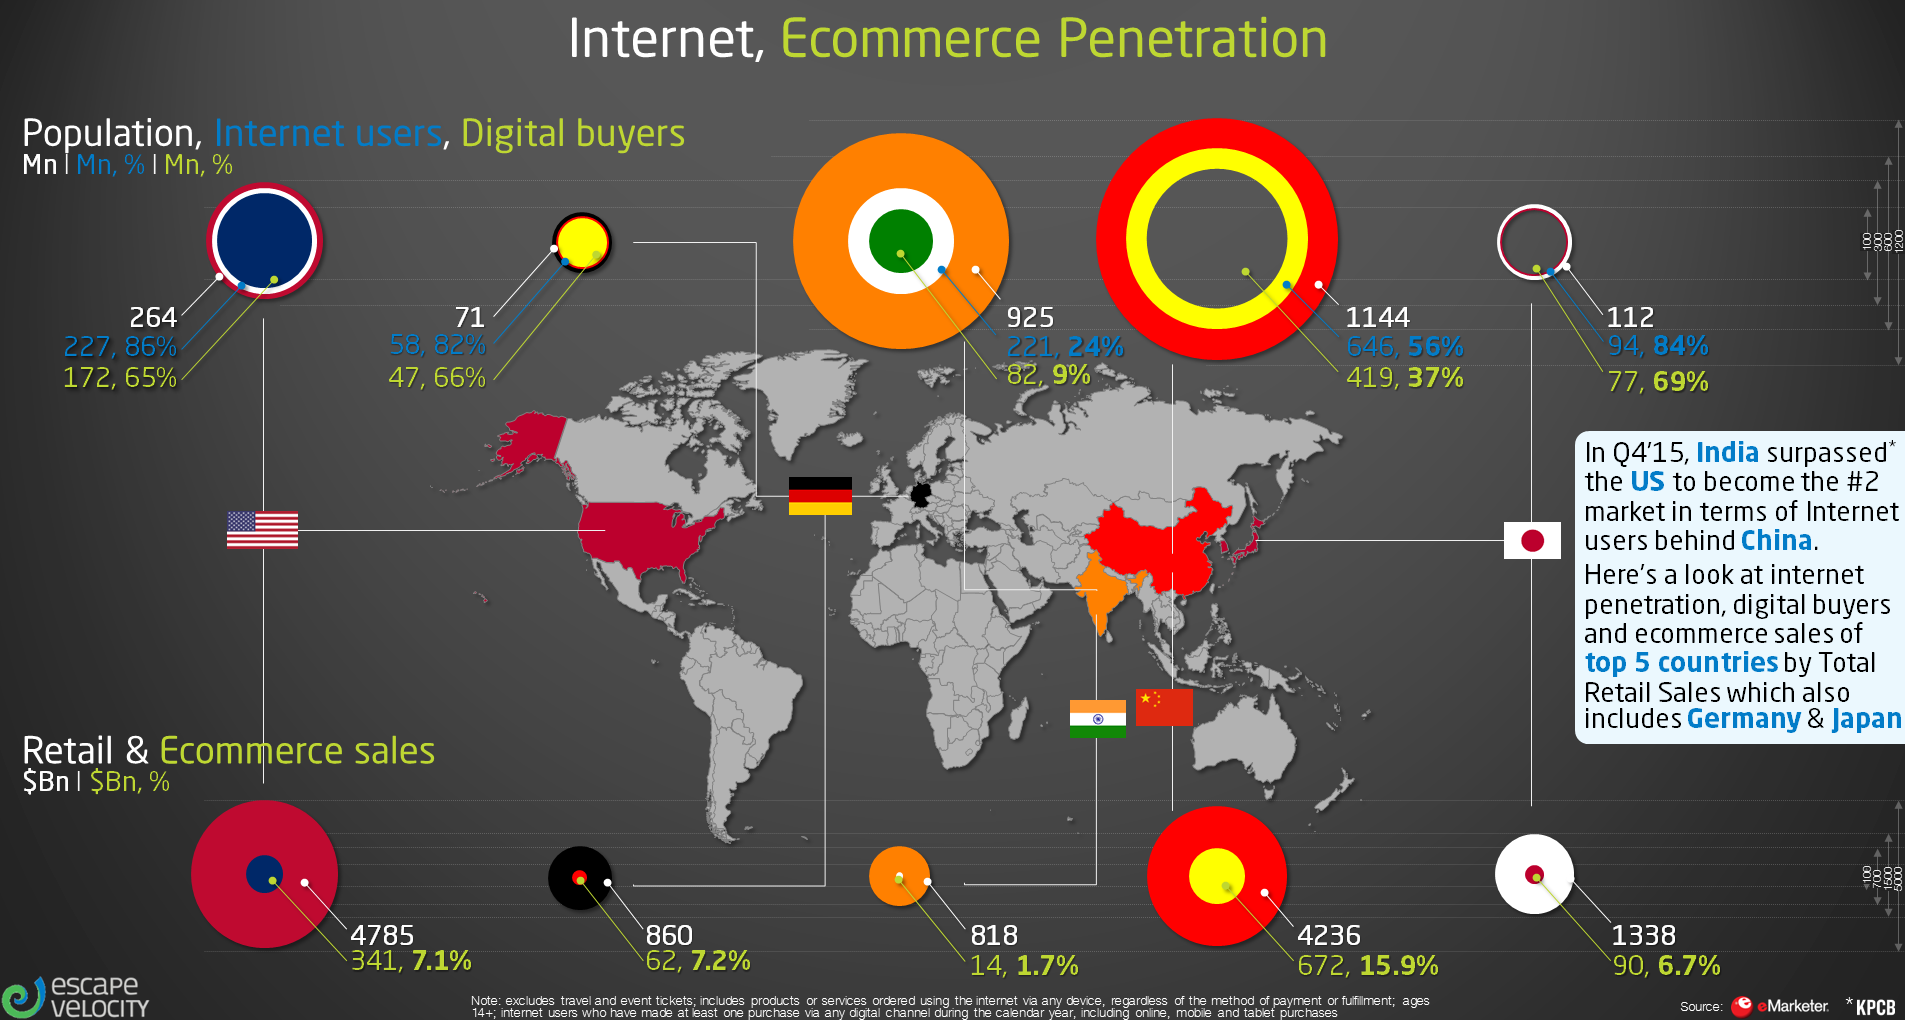
[Since there’s a lot of information in this infographic, here’s how to read it :
Each of these five countries is linked to two sets of concentric circles, one in the top half of the chart and one in the bottom half of the chart. The set of concentric circles on the top had population numbers and that at the bottom has sales figures. Now for the details.
Let’s consider India as an example. The outermost circle in the top set of concentric circles for India tells us that our country has 925 mn people aged 14 years or more. The circle inside it shows that of these 925 mn people, 221 million or 24% are internet users. The innermost circle shows that only 82 Mn – or 9% of the 925 mn people – are digital shoppers and make online purchases of goods and services other than travel and events.
The bottom circle linked to each country shows the total value of retail sales and the proportion that is conducted via e-commerce. For instance, total retail sales in India are estimated at 818 Bn USD, and that conducted over e-commerce is just 14 Bn USD, or 1.7% of the total.]
So in spite of all the hype around this channel and the huge spend on advertising by the e-commerce players, a mere 9 % of our population shops online, and these purchases account for only 1% of total retail sales. Why only 1% ? Either due to a lower frequency of shopping online vs. visiting a retail store and / or due to a lower value of goods being purchased online. The latter seems unlikely since a large proportion of online sales are for mobile phones and accessories, followed by apparel and footwear, so it must be the low frequency to blame. Two big obstacles for e-commerce to surmount are now clear – the low penetration of online shopping amongst internet users, and the low frequency of online shopping among those that do shop online.
On to our neighbour China. While 56% of their total population is online, over half of these make purchases online. No wonder that sales through the e-commerce channel are 15.9% of total retail sales in China, as the bottom circle shows.
Surprisingly, though the US has a far greater proportion of population that makes purchases online ( 65% of its total population buys through e-commerce), these account for only 7.1% of total retail sales. Wonder whether it’s the ugly frequency problem rearing its head again, or whether it’s due to low unit value of goods purchased.