This infographic was made for the Escape Velocity blog.We’d earlier shared a set of infographics on per capita expenditure on various categories in urban India, and the trends over time therein. This post shares similar data for rural India.
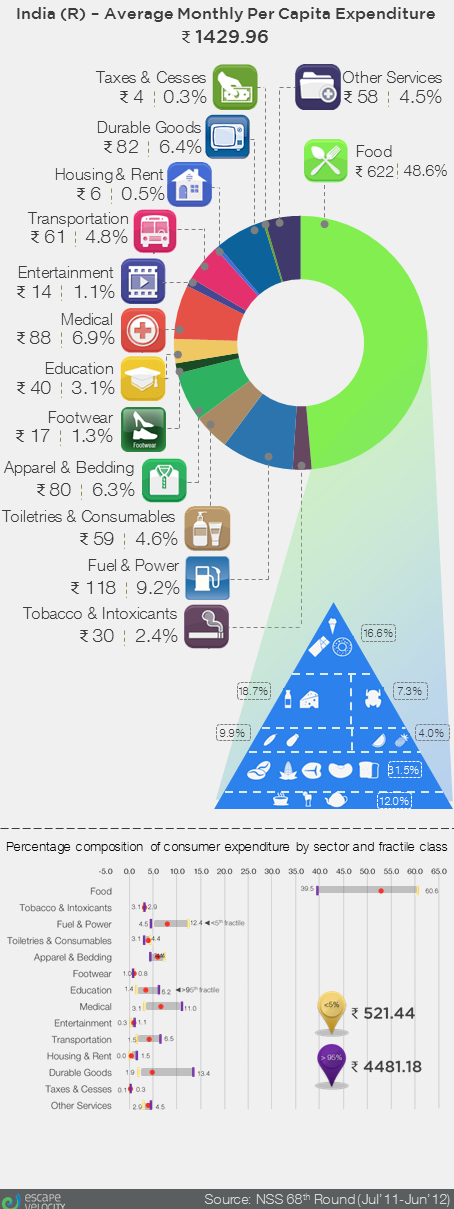
The first point to note is that the average MPCE (monthly per capita expenditure) is much lower for rural India vs. that for urban India (Rs. 1429.96 vs. Rs. 2629.6 respectively). Hence, while the absolute value of expenditure on various categories may be lower in rural India, as a percentage of the MPCE it’s much higher. For instance, though the average monthly spend on food is Rs. 622 per capita, it is 48.6% of the total per capita expenditure ; this is closer to the proportion spent by the poorer fractiles of the population in urban India. One area on which folk in rural India spend much less than their counterparts in urban areas is housing, others are education and transportation. In almost every other category, the proportional spends (spending on category as a % of average MPCE) of rural folk are actually higher than those from urban areas.