This post was written for the Escape Velocity blog and first appeared there.
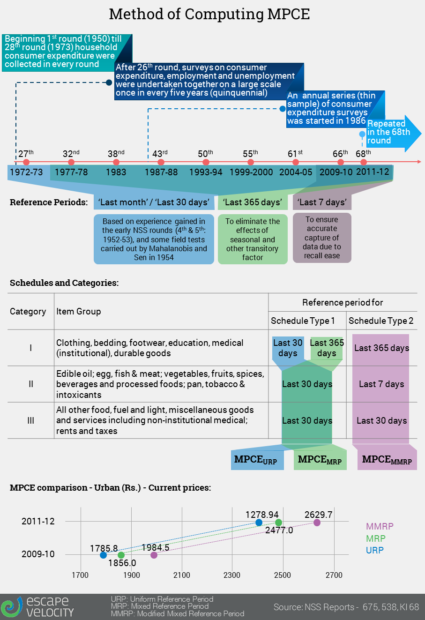
This post is just a follow-up to the previous post – fulfilling my promise of illustrating how the MPCE is calculated.
- The process has evolved over time to the current large sample quinquennial surveys (once in 5 years)
- Broadly, the endeavor has been to get more accurate data and time periods have been appropriately chosen / designed to capture certain data.
- The household consumer expenditure schedule used for the survey captures both information on quantity and value of household consumption.
- Info collected consists of 142 items of food, 15 items of energy (fuel, light and household appliances), 28 items of clothing, bedding and footwear, 19 items of educational and medical expenses, 51 items of durable goods, and 89 other items.
Whew ! That’s a lot, isn’t it ?


