Escape Velocity, Infographics, Visualisation

India – Internet Statistics

This post was written for Escape Velocity Blog and first appeared there. Since we’ve received some questions after the last two posts,...

· 15 sec read >

This post was written for Escape Velocity Blog and first appeared there.


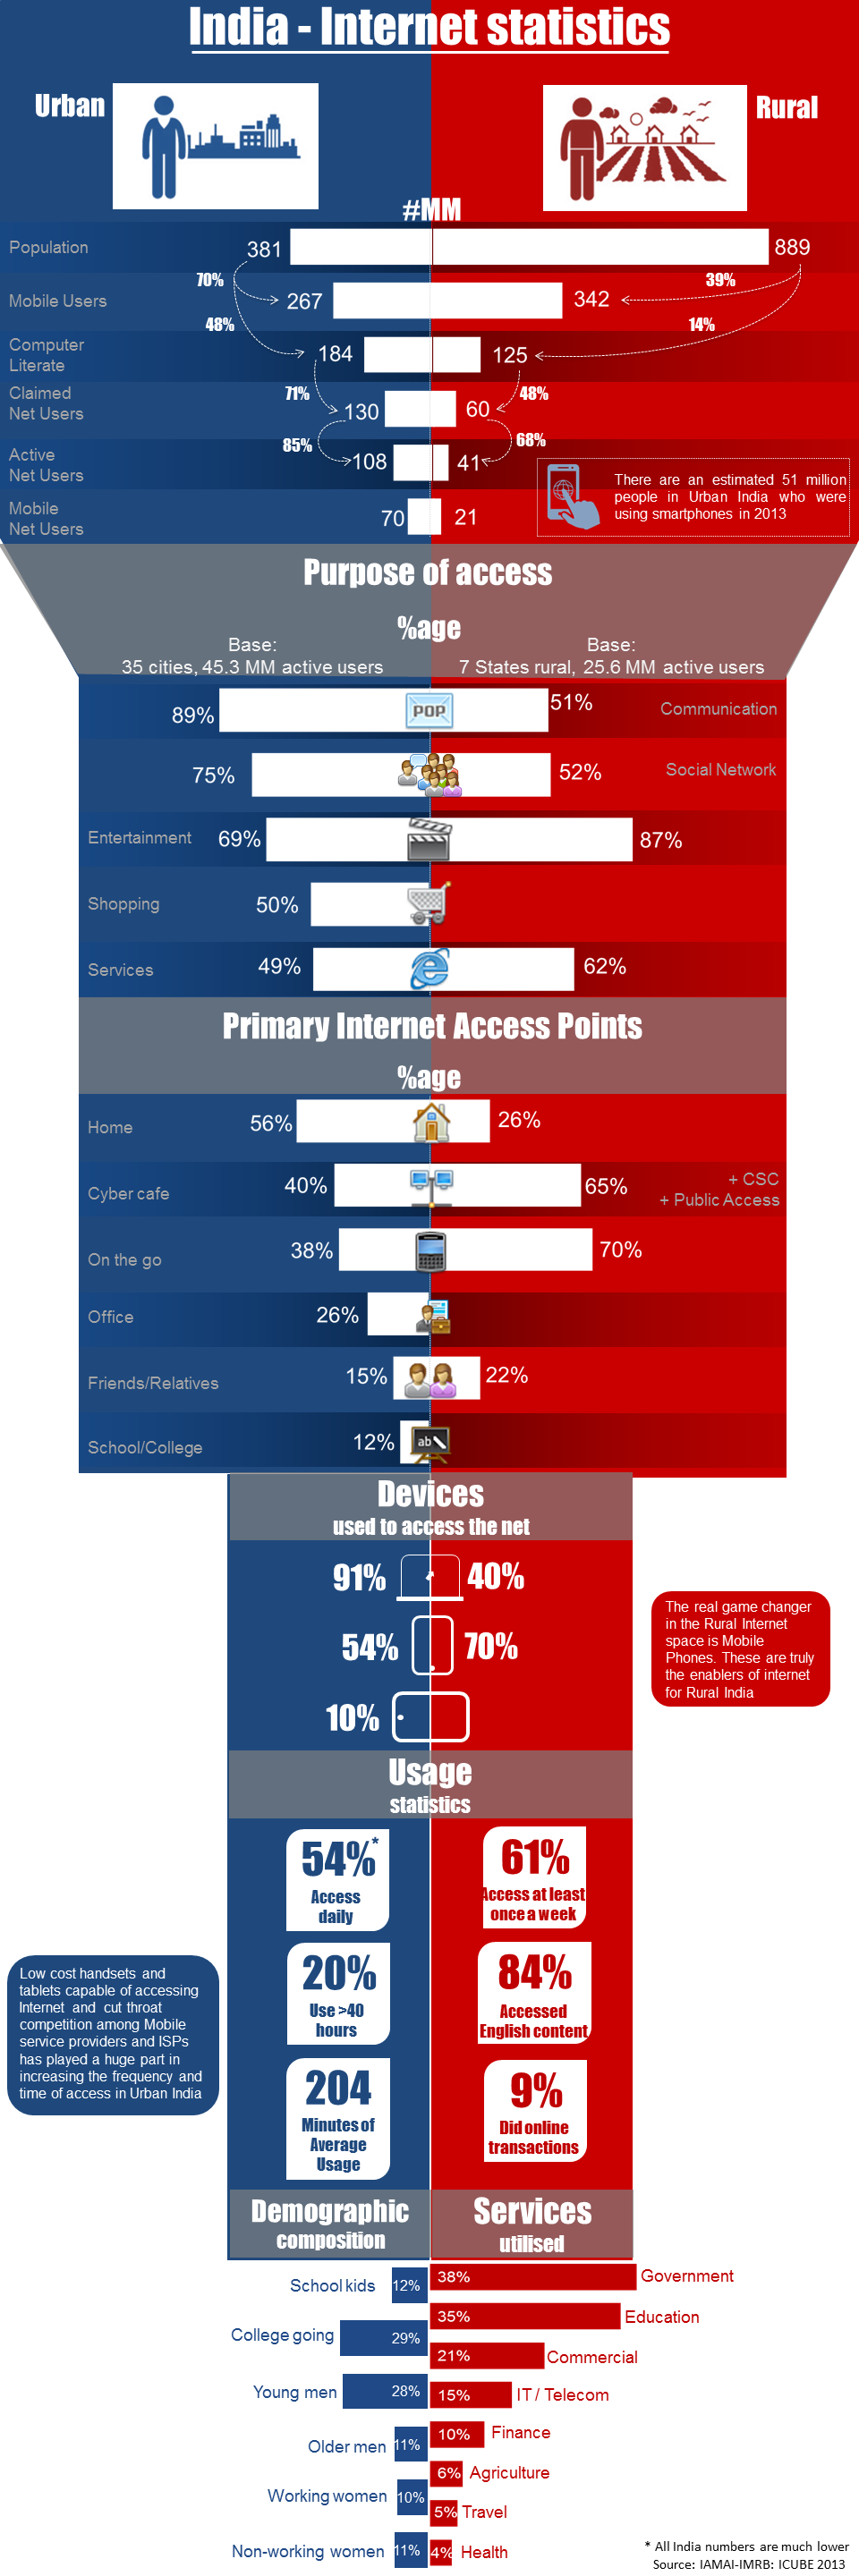
Since we’ve received some questions after the last two posts, we felt that it was time to share some more data on this topic. As this info-graphic is quite detailed, we may write a post or two on some of the implications of the numbers in this one , but you’ll have to wait a week or two to read those.

COVID-19 Clinical Trials in India

in Analysis, Medicine, Visualisation
  ·   13 sec read

Letter to myself…

in Linkedin, Marketing, Musings, Trends, Visualisation
  ·   48 sec read

Leave a Reply

Your email address will not be published. Required fields are marked *

This site uses Akismet to reduce spam. Learn how your comment data is processed.