
This post was written for the Escape Velocity blog and first appeared there.
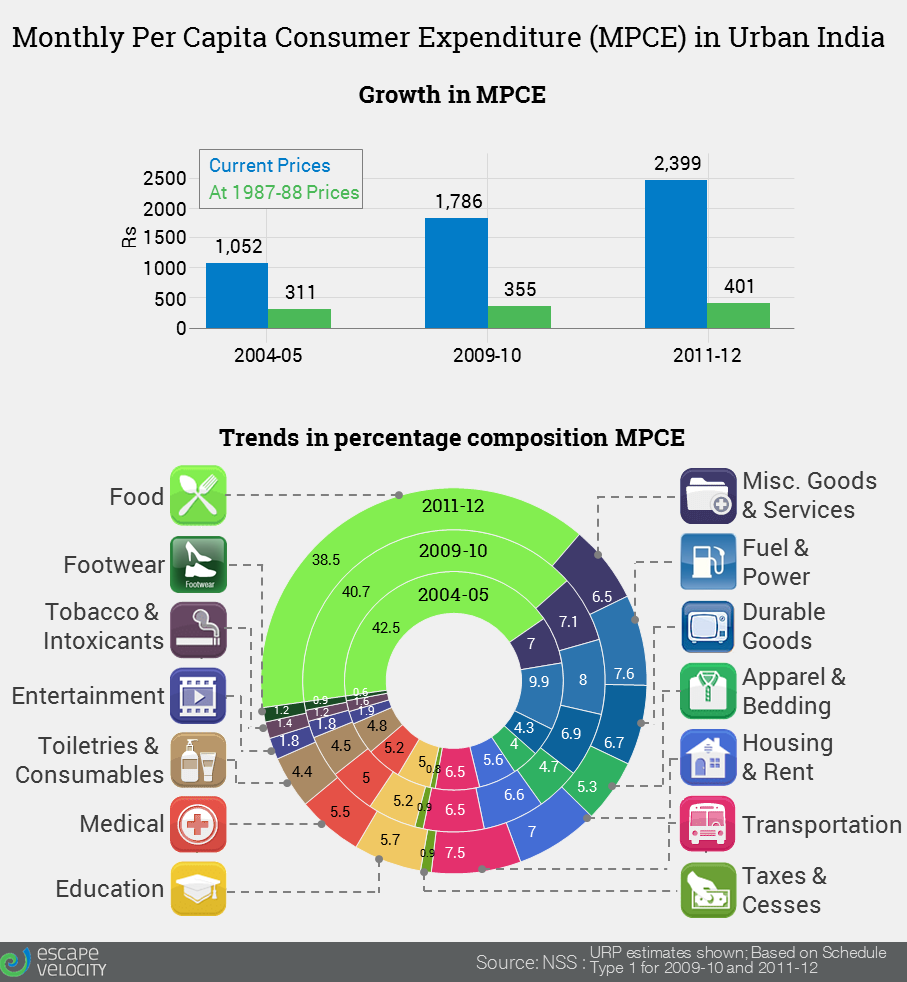
- Urban India has seen an increase of 128% in MPCE(URP) based on current prices
- Real MPCE (measured using a price deflator with 1987-88 as base) has increased 29% between ‘04 to ’11, a CAGR of 3.7%
- Share of food in MPCE declined by about 4pp in urban India between ’04 -’12 , you can clearly see the light green band receding from the right end
- A few more points that are not shown in the graph :
- Within foods, except for Milk, fruits & Beverages, all other products categories tracked have fallen in contribution.
- While Milk and fruits has increased by 1pp, beverages have increased from 15% to 18% within foods
- Cereals have registered the largest decline – from 24% to 19%
- Within foods, except for Milk, fruits & Beverages, all other products categories tracked have fallen in contribution.
- Among the rest of expenditure, durable & minor durable type goods has seen the highest jump of 2.4pp followed by rent at 1.4pp and clothing & bedding at 1.3.
- Also, notice the steady rise in medical and education expenses
- Proportion of spends on entertainment have also risen, albeit off a small base
- A few more points that are not shown in the graph :
The method of computing MPCE is rather interesting ; next week we’ll share an infographic on that too.