About a year back, I had noticed a high number of Tweets with the hashtag adtechin (#adtechin) from a few people I follow. Due to curiosity and time at hand, I decided to give the hashtag a closer look. So, put together a small program to collect all tweets thru Twitter API and then looked at the collected data. This old post gives some summary of the analysis.
This year too, my Twitter feed showed up #adtechin. Re-ran the old program with some changes and the following is an analysis of trends over 2 years. Firstly a caveat, I have attended neither of these Adtechin conferences and except a few people, I don’t have a clue on who the Tweeters are. I am also not sure that 100% of tweets on this topic or hashtag are captured using the program (pure laziness in reading Twitter API help).
In 2011, the conference was held in the month of April in The Leela, Gurgaon. In 2012, the same was held at Sheraton, Bengaluru. I am not sure if its the speaker quality or the reduced interest in social media or the city and venue, but 2012 saw 1598 tweets vs. 3447 tweets in 2011. Thats a 54% decline in tweet volume straight away.
The number of RT’s declined too but not as much – by about 33%. But, it should be noted that the RTs were majorly generated over 3 days in 2011. While this year, the RTs were generated mostly over one day. Net-net more RTs on the main event day. 741 vs.641 previous year.
But surprise, the # of tweets with links increased by 61%. I am not sure what the links point to (analysis of these links and quality of links might be a good future exercise!) and don’t have the enthusiasm to manually check a few.
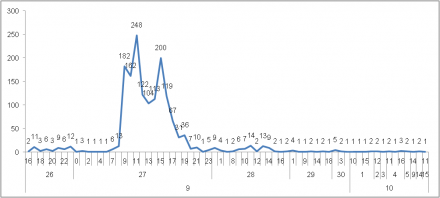
As mentioned earlier, the tweets in 2011, poured over 3 days, 27th to 29th April and then completely died down. The tweets in 2012, came in from 26th September and went on till about 15th October (and counting) while 27th was the main day.
| 2011 | 2012 | ||||
| % of Tweets | % of Tweets | % Growth | |||
| Number of Tweets | 3447 | 1598 | -54% | ||
| Number of links | 163 | 5% | 262 | 16% | 61% |
| Number of RTs | 1228 | 36% | 821 | 51% | -33% |
| First Tweet in Archive | 27/04/2011 10:12 | 26/09/2012 16:21 | |||
| Last Tweet in Archive | 29/04/2011 19:32 | 15/10/2012 11:35 | |||
As with the previous Adtechin, the peaks happened at 11 AM and 1 PM when there were discussions and presentations happening around social media.
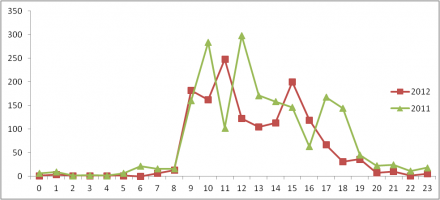
And its also getting very predictable, the graph below compares the tweets on the peak tweet days by time from 2011 (28th April) & 2012 (27th September). There is a very clear buildup / anticipation, the highlight presentation and the (disappointed?!) sign off. Going by this, I question the need to have a full day or two full day conference if just 2 presentations or discussions are talked about.
The number of Tweeters fell by 58%. Unlike 618 Tweeters last time, 2012 saw only 258 Tweeters (my estimate is that 237 of them are inter connected with 1 degree of separation at best – more on this later). The top Tweeter went over board with his tweets, doing more tweets that the top Tweeter from last time!
The top 10 tweeters (3.9% of Tweeters) generated 41% of the tweets. And these guys were (name, tweets, % of all tweets generated)…
- Rammohantweets: 180:: 11.3%
- dhempe: 77:: 4.8%
- strategicindia: 68:: 4.3%
- Namitaved: 66:: 4.1%
- amit6060: 55:: 3.4%
- TechButthead: 48:: 3.0%
- morpheushere: 45:: 2.8%
- Sandhyam81: 43:: 2.7%
- anandan22: 35:: 2.2%
- srraja: 32:: 2.0%
And as last time, the top Tweeter was an employee of the company that was organizing the event.
There were 47 people in common between the 2 events. More importantly , 6 of the top 10 tweeters form 2011 were absent here (and only 5 from the top 20 tweeters from 2011 attended the event at Bangalore).
The top 5 Tweeters in 2011, who generated 26% of the tweets generated only 4% of the tweets in 2012 (only 3 of them actually). The top 5 from ’12 common to ’11 and vice versa…
| 2012 | 2011 | |||||
| Tweets | %age | Rank | Tweets | %age | Rank | |
| Rammohantweets | 180 | 11.3% | 1 | 63 | 1.8% | 7 |
| dhempe | 77 | 4.8% | 2 | 2 | 0.0% | 197 |
| Namitaved | 66 | 4.1% | 4 | 25 | 0.6% | 33 |
| morpheushere | 45 | 2.8% | 7 | 50 | 1.5% | 8 |
| Sandhyam81 | 43 | 2.7% | 8 | 2 | 0.0% | 197 |
| 2011 | 2012 | |||||
| Tweets | %age | Rank | Tweets | %age | Rank | |
| kushalsanghvi | 79 | 2.3% | 3 | 1 | 0.1% | 130 |
| Rammohantweets | 63 | 1.8% | 7 | 180 | 11.3% | 1 |
| morpheushere | 50 | 1.5% | 8 | 45 | 2.8% | 7 |
| vishal1mehra | 45 | 1.3% | 12 | 1 | 0.1% | 130 |
| ishashah | 38 | 1.1% | 19 | 27 | 1.7% | 12 |
The total follower count of these 258 tweeters in 2012 is about 2.25 lakhs (this is not an un-duplicated reach number).
Managed to get the descriptions the Tweeters gave themselves on their profile with the program as well. The world cloud gives a nice clue of their background and its pretty much what they talked about during adtechin.
4. Re Tweet & conversation Trends
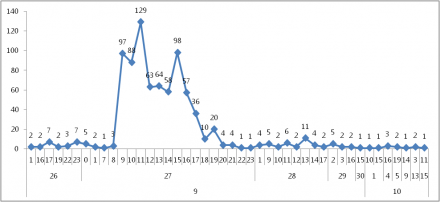
Noticeably, the re-tweets were to a much higher degree on the main event day.
This time around I managed to capture replies and conversations happening between people as well. 130 tweeters interacted among themselves. The maximum was dhempe interacting with 17 people followed by strategicindia with 11 tweeter interactions.
In total, only 73 tweets were replied to. No great thoughts, discussions or debates on tweets. Sample all the top ones which got a grand 2 responses each…
What is correct hash tag for Adtech Bangalore? Is it #Adtech or #adtechin ?
— CellStrat (@CellStrat) September 27, 2012
Social media proves “Content is King” but “Conversation is the Key” !! #adtechin
— Social Media India (@cijoaj2003) September 27, 2012
#AdTechIn trending in India already – congrats @adtechindia :)
— Hrish Thota (@dhempe) September 27, 2012
I’m last minute entrant in the Panel on SoLoMo #adtechin going up in 15 mins
— Madan Sanglikar (@maddyisms) September 27, 2012
A good day at #adtechin . The team did a very good job. Hat tip to @rammohantweets@namitaved and the other ninjas :)
— Mansi T. (@media_reveries) September 27, 2012
So nothing to write about. Whoever said, discussions happen over twitter.
Essentially 4 words sum up the entire chatter in order of importance – media, mobile, social & marketing.

